StrategyBlocks Feature Focus – Dashboard Editing Made Easy
The Evolution of Dashboards
When we look back at the dashboards that we’ve created for customers in the past and compare them with what we’re creating at StrategyBlocks today, it’s apparent that they are becoming considerably more visual, engaging, and comprehensive. Yet we are always striving to deliver this data in a way that is easy to interpret and can be consumed quickly by business people. The trade-off comes in the form of design and construction.
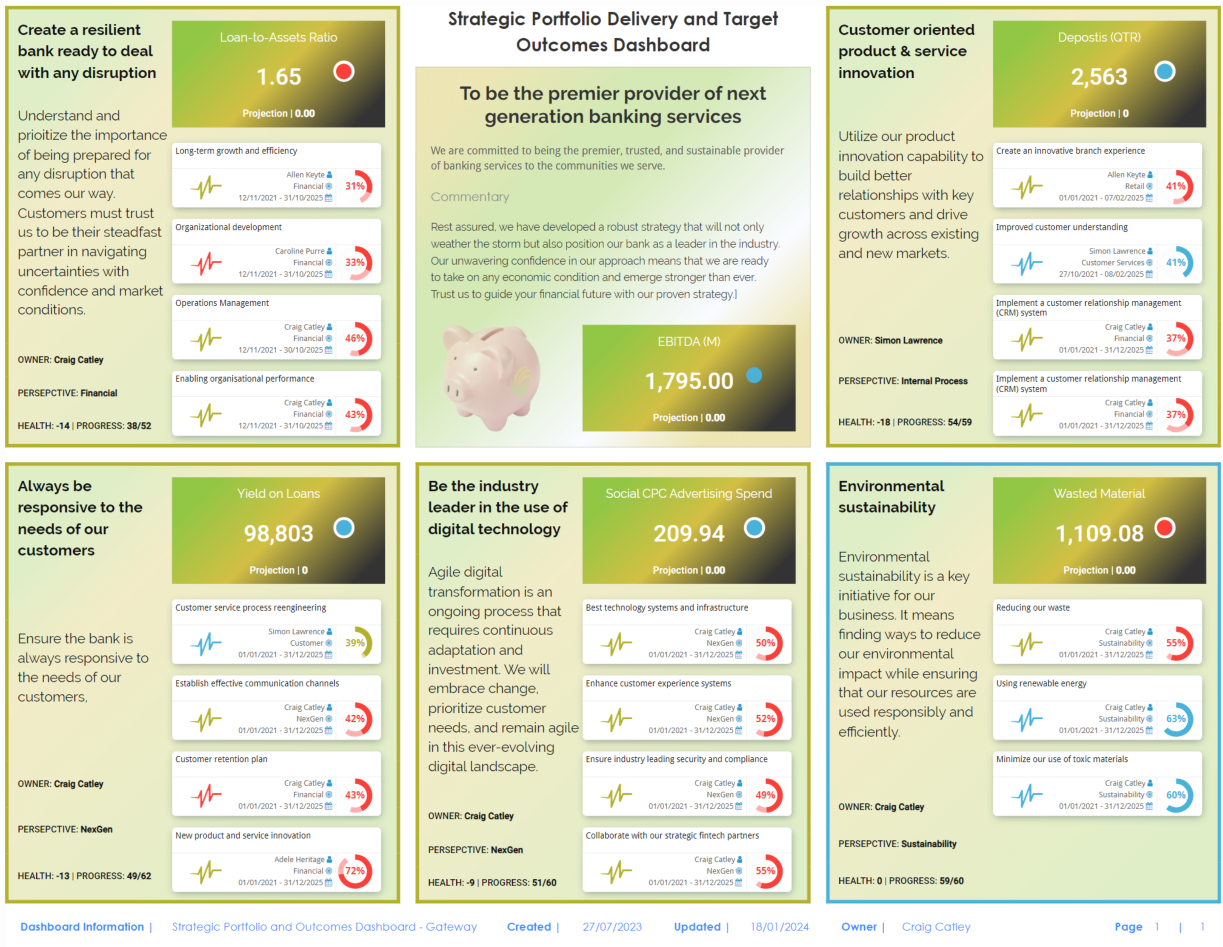
The dashboard above is my current favorite, although I am sure that won’t last for long. It displays 3 different variables of strategic performance: the aggregate delivery progress of all projects in flight across the enterprise by portfolio, grouped by goal with the overall ‘strategic health’ of each strategic goal, and a key outcome metric (KPI) for each goal and vision. It also displays all the governance metadata relating to the dashboard.
This dashboard is just 1 in a family of integrated dashboards guiding the viewer down a drill path to more detailed granular strategic views, but this dashboard alone has 52 visual elements, grouped into 5 containers each spanning 3 levels deep, color gradients and transparent images.
More Dashboard Tools
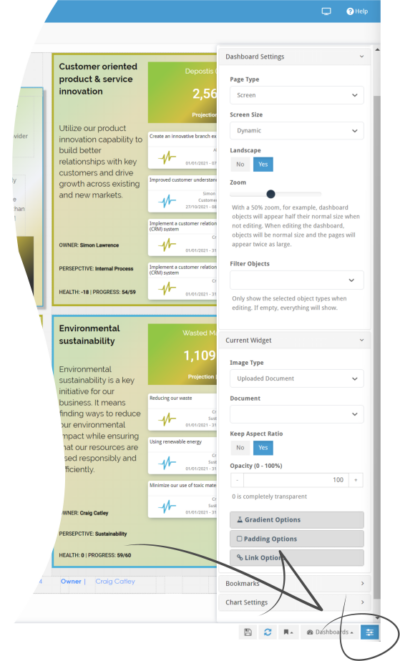
We have been progressively adding tools and shortcuts to StrategyBlocks 6 to make life easier for dashboard creators. The Options Pane has been extended significantly to keep the dashboard open as you adjust and tweak each widget – now almost all the properties of a widget can be edited from this panel without having to open the widget properties page.
Dashboard Settings from the Control Panel
Dynamic Size – allows the canvas to expand automatically as widgets are added and moved.
Zoom – reduces or enlarges the scale of dashboard contents so more widgets can be added or widgets can appear larger.
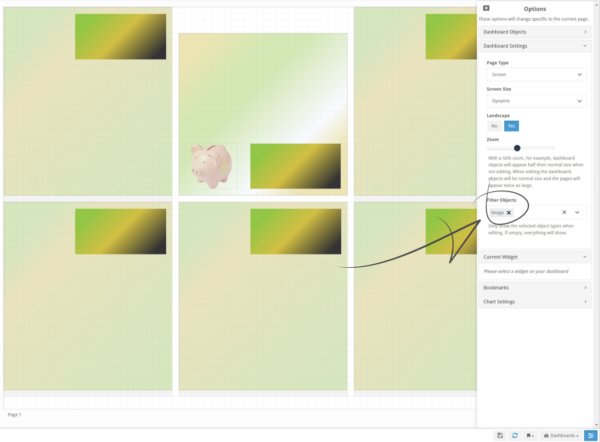
Object Filter – displays only selected widgets. When numerous widgets are layered, this makes it easier to edit directly those widgets and minimize on screen clutter.

Current Widget Settings from the Control Panel
Clicking a widget will display its properties in the Current Widget pane. Depending on the widget type, these can include:
- Widget Type and View settings
- An HTML widget script editor
- Label text format settings
- Link Options to create dashboard-to-dashboard drill paths
Added more recently is the ability to:
- Add color gradients to shapes and images
- Add padding to shapes, images and lines to control their exact on screen position
- Add opacity to alter a widget’s transparency
Making it Easy
Having the edit controls conveniently placed beside the dashboard in edit mode greatly enhances the efficiency and ease of editing. Users can now fine-tune and customize the properties of different widgets without the need to navigate away from the dashboard. It not only saves time but also ensures a more seamless and enjoyable user experience. By placing the power to edit at your fingertips, dashboard creators can create visually stunning and functional dashboards with precision and flexibility.
We always welcome you to book a strategy dashboard workshop for a personalized dashboard building session.


Leave A Comment