
New Dashboard Table Objects: Unleashing Multi-Dimensional Data on Demand
At StrategyBlocks, we continually strive to enhance the way you manage and communicate your data. Our latest feature – dashboard table objects – enables you to add dynamic tables displaying your blocks, risks, or metrics directly on your dashboards. With these new tables, you can now easily share a granular yet comprehensive view of your data, whether with internal teams or external partners.
Why Tables? The Power of Multi-Dimensional Data Visualization
Tables are more than just rows and columns—they’re powerful tools that make complex data simple to read and act upon. Here’s what sets our new table objects apart:
- Multi-Dimensional Clarity:
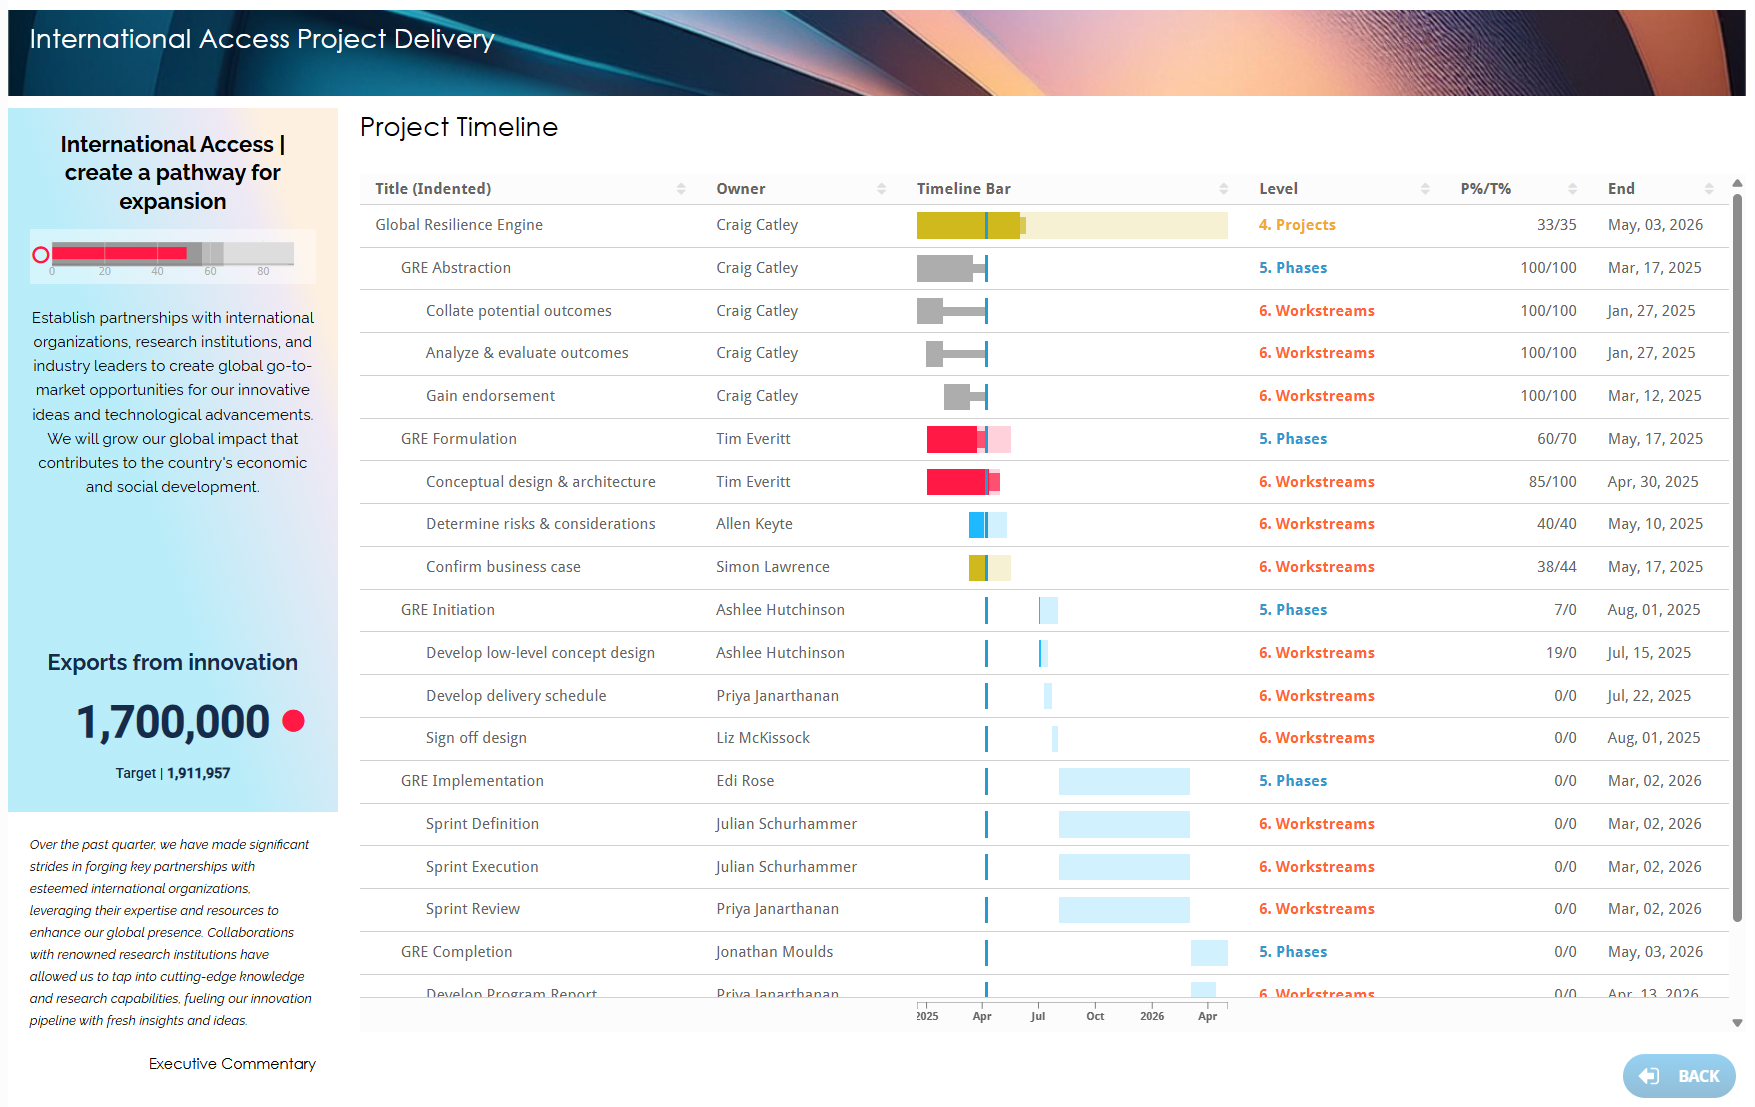
Tables can host a large number of fields simultaneously, allowing you to present multi-dimensional data at a glance. When you need to monitor numerous metrics or risks, a table lays out every detail in one place, enabling you to see relationships and anomalies that might be buried in a chart or summary view. - Precision and Granularity:
Unlike charts that aggregate data into trends, tables showcase the exact figures behind every measure. This level of detail lets users drill down into the data and supports tasks such as risk assessment or fine-tuned performance analysis. - Interactive Sorting & Customized Views:
Viewers can click on any column header to quickly sort the table, uncovering patterns or anomalies that inform strategic decisions. Additionally, dashboard creators can pre-define the default order and arrangement of columns. This means that every time your table loads, it can highlight the most critical metrics in the order that matters most to your business. - Robust Filtering & Advanced Data Management:
Our table objects come with powerful filtering options. Whether it’s by users, dates, status, or any other field, you can immediately narrow down the data to focus on what’s relevant. Plus, you have full control over whether to implement pagination and search features—essential when dealing with large data sets—ensuring that every table remains both manageable and scannable. - Versatile Sharing & Consistent Data Presentation:
With these tables, you can seamlessly share rich, detailed reports with both internal teams and external stakeholders. The interactivity ensures that every viewer can explore the data for themselves, whether they’re interested in a high-level overview or diving into the nuts and bolts behind the numbers.
Empowering Data-Driven Decision Making
Dashboard table objects bridge the gap between high-level visualization and granular data analysis. By providing a space that’s both customizable and interactive, these tables empower you to:
- Instantly identify critical trends and outliers
- Facilitate collaborative discussions with precise and actionable data
- Maintain data integrity in multi-dimensional environments, no matter how much information there is to share
Having the capacity to see not just the overall trends but also the specific details behind your key performance indicators is crucial. With our new dashboard table objects, you can drive more informed decision-making, optimize strategies in real time, and elevate your data reporting to a whole new level.
Start Harnessing the Power of Tables on Your Dashboards
We’re excited for you to explore this new feature and see how it can transform the way you interact with your data. Whether your focus is on tracking risks, monitoring metrics, or sharing critical blocks of information, our table objects make your dashboards more robust, detailed, and actionable.
Leave A Comment