Calculating KPIs (outputs)
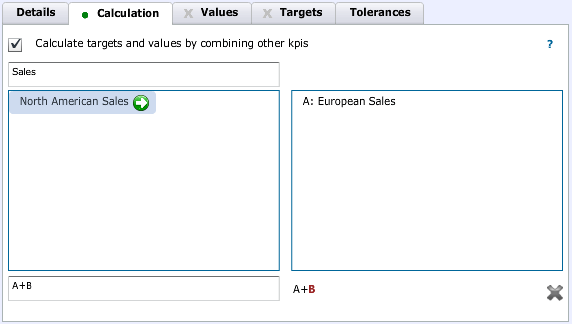
As a simple example, let’s take something a situation like sales across multiple regions. For instance, you might have sales in North America and sales in Europe. These regions will each have their own independent targets and actuals, but, as the manager of global sales, you would want to have both sets of data rolled up into one KPI without having to manually duplicate and sum the data. In the most recent version of the product you can create a new Global Sales KPI and select the calculation tab:

When the checkbox is selected, the values and targets tabs have editing disabled and they become the result of the expression defined on the calculation tab. In this case, we’ve typed “Sales” into the filter and we’re adding North American Sales KPI to the list of calculation variables. Notice that each in the list will be prefixed with a letter (e.g., A for European Sales and North American Sales will become B).
The input box at the bottom of the form is where the calculation can be typed as you’d like to define it, using the prefixes as variables (e.g., A, B); To the right of the input box we show the results of parsing the calculation, and a status icon indicating whether we support the expression or not. In complicated expressions, we introduce brackets “()” based on our interpretation of precedence rules but those can be added on the left side to remove any ambiguity.
Assuming the calculation is valid, once you submit the KPI the server will calculate a new series of values/targets based on the expression and redraw the chart. In the above example, if you have a target of 5000 for December 31 in North America, and one of 3000 in Europe, the Global Sales target would be 8000 for the same date. When the manager of North America increases the target to 5500, Global Sales automatically picks that up and becomes 8500.
Calculated KPI’s can also be used as a mechanism to create ratio calculations on the fly. Creating ratios and being able to conveniently monitor them on an on-going basis can be challenging, but they are an important way to benchmark organisational performance. For instance, something simple like the profitability of a product or “gross profit margin” can be created by dividing Gross Profit by the Sales, or a “price to earnings ratio” can be created by dividing Share Value by Earnings Per Share. Even more complex calculations like a valuation ratio can be produced: (Market Cap-Total Debt)/EBITDA. StrategyBlocks provides a flexible intuitive way to achieve this.
These calculated KPIs are treated the same as any other KPI in the system. When they are attached to blocks, their charts can be displayed in the blocks view, and they contribute to the health calculation. They can also be used in subsequent KPI calculations allowing users to create their own ad-hoc hierarchies of KPIs.


Leave A Comment