
Feature Focus – Updates to StrategyBlocks in August
The latest enhancements are live in StrategyBlocks 6! The August release brings you powerful new table features and enhanced dashboard capabilities for a more intuitive and efficient experience.
Table Views: Enhanced Organization and Flexibility
- Frozen Header Row: Couldn’t find the top row? Now you can. Easily keep your table headers in view, even when navigating through large datasets of blocks, metrics, and risks. This improves readability and saves you time.
- Filter on Non-Visible Columns: Need to sort your data by a specific field, but it’s not visible in the table? You can now conveniently order your blocks, risks, and metrics tables by any column ascending or descending, even if it’s hidden.
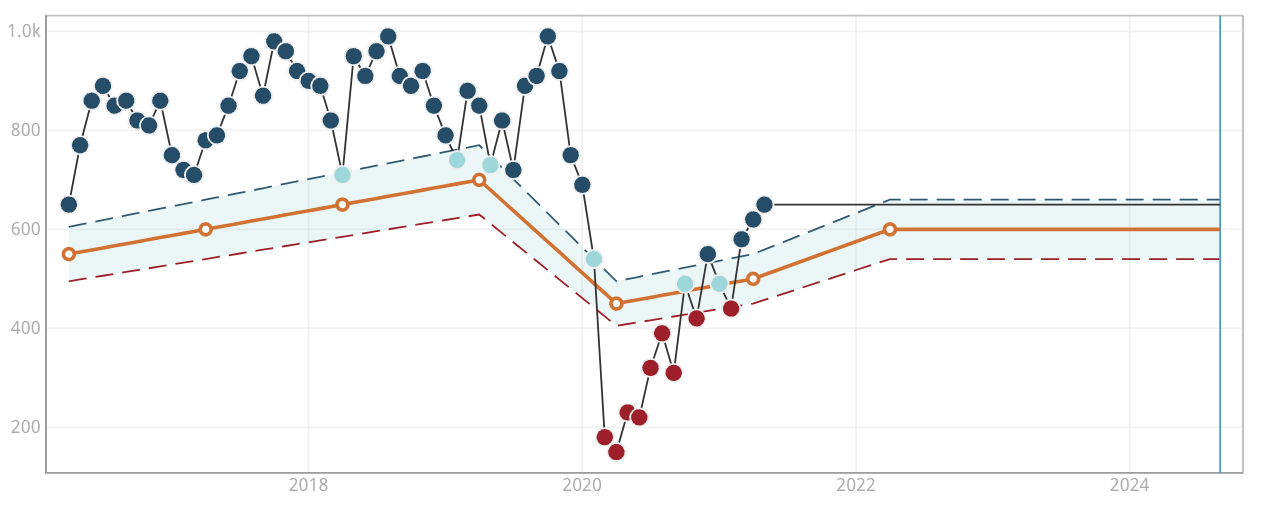
Dashboard Multicharts: Deeper Insights, Enhanced Control
- Quarterly Aggregation: Get a clearer picture of your progress by aggregating data on a quarterly basis! Complement your existing aggregation options with quarterly insights for a more comprehensive analysis.
- Y-Axis Scale Control: For charts with metrics measured in the same units, you can now manually set the y-axis scale with a numeric dropdown or a free text field.
Dashboard Containers: Streamlined Workflows
- Default Objects: Save time and simplify container creation! Containers now support default objects, allowing you to specify a block, metric, or risk that will automatically populate. This eliminates the need for manual configuration and ensures consistency throughout your dashboard.
These new features are designed to help you:
Visualize your strategy more effectively with enhanced table views and multichart capabilities.
Gain deeper insights into your data with quarterly aggregation and cascading metrics.
Work smarter, not harder with streamlined container management and default objects.
Leave A Comment