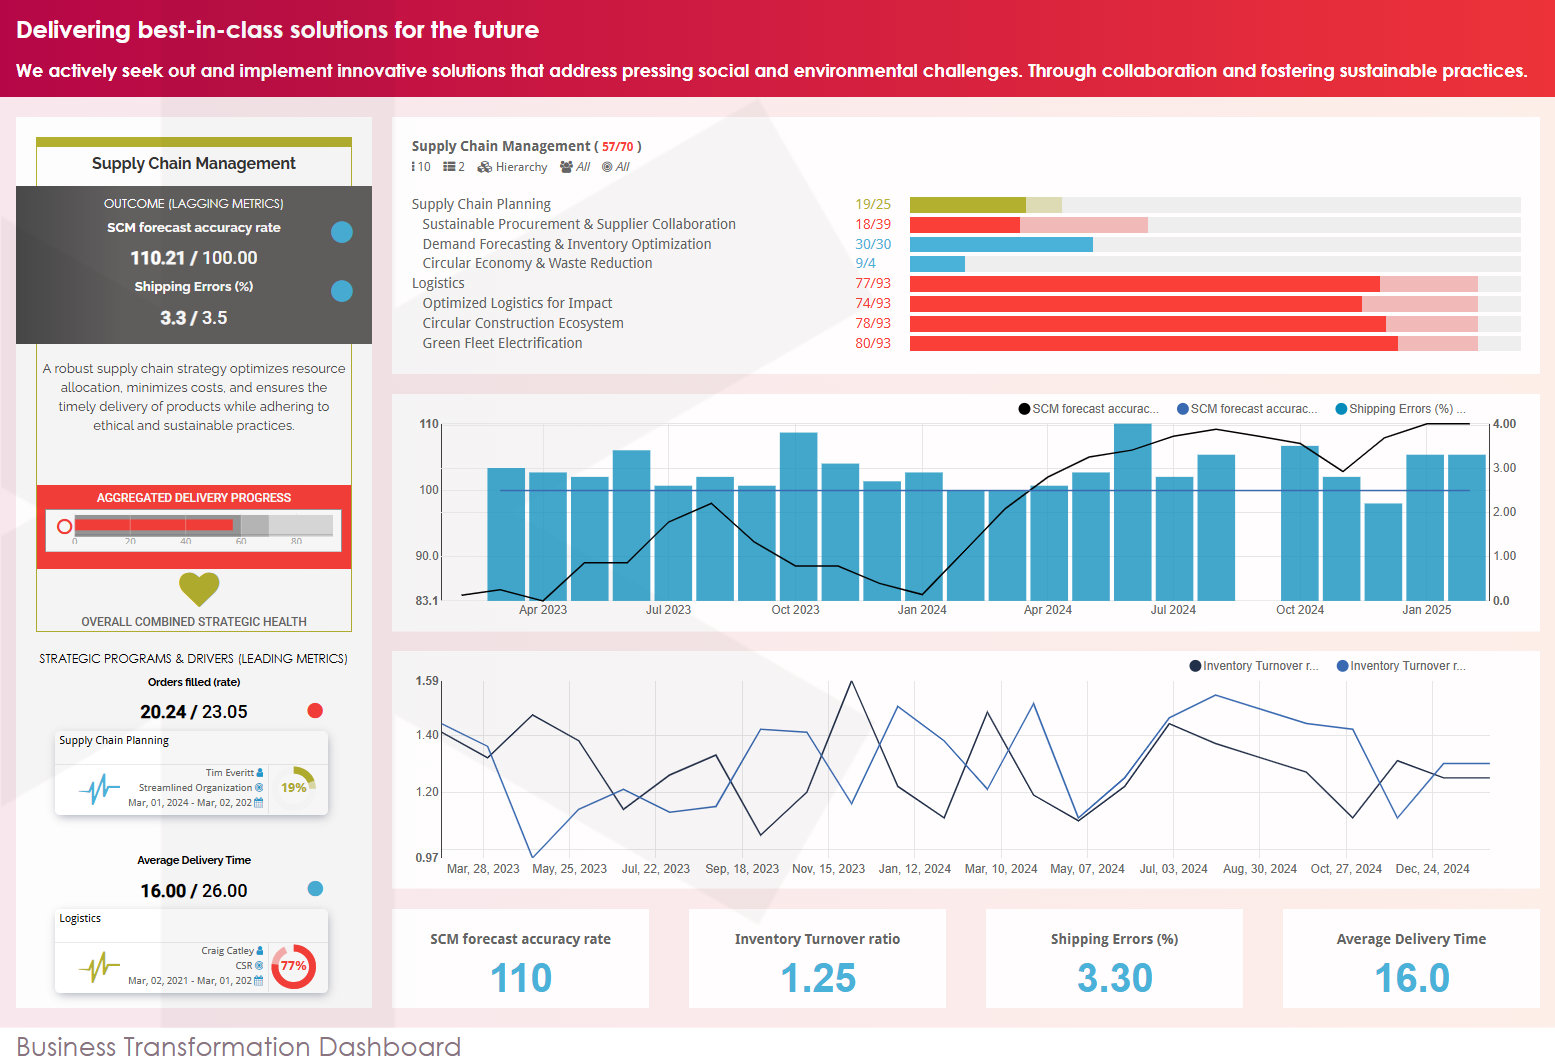
Strategic Dashboards: The Guide to Measuring What Matters
You’ve put in the hard work. The strategic plan is mapped out, you know the “what,” “when,” and “who” for getting things done. Now comes the tricky part: actually tracking if it’s working! How do you quickly see if your organization is moving towards those big, audacious goals? The answer? Strategic dashboards.
But not just any dashboards. We’re talking about custom dashboards that give you a clear view of the critical things your success hinges on. Let’s dive into how these dashboards can help everyone in the company see how they contribute to the big picture and what to think about when you’re starting with a blank slate.
First Things First: Who’s Looking?
When you’re building any kind of dashboard, you have to think about who will be using it. A strategic dashboard isn’t just about day-to-day operations; it’s about keeping an eye on the long-term health of the company, using those factors that are make-or-break for your strategy.
Now, you might think this is only for the top dogs, but think again. Every team, department, everyone has a role to play in this journey. StrategyBlocks lets you whip up multiple dashboards, each geared toward the specific goals of different groups. And you can link them together, so everyone sees how they fit in!
Critical Success Factors: More Than Just Numbers
Strategic dashboards, unlike the dashboards used for daily tasks or deep analysis, aren’t just about Key Performance Indicators (KPIs). The important ingredients for successfully executing your strategy include things like:
- Progress Check: Milestones achieved?
- Completion Status: Tasks and projects getting done?
- Heads-Up: Seeing risks before they cause damage?
One part of your plan might be all about getting projects across the finish line, while another might be focused on hitting those financial targets. Make sure your dashboards show what’s relevant.
Think Beyond the Usual Suspects for “Measurements”
Yes, those classic KPIs (we call them Metrics in StrategyBlocks) will always be useful on strategic dashboards, but don’t box yourself in with just the usual financial data. Here are some examples of metrics you might want to visualize on your dashboards: For Operations, instead of just efficiency, consider displaying process cycle times to quickly identify bottlenecks. Product teams could show bug report resolution times, highlighting their responsiveness in addressing issues, and HR can track training program effectiveness scores to gauge the impact on employee skill development. By moving beyond basic KPIs, your dashboards become powerful tools for understanding the true drivers of your strategic outcomes.
Good Design Matters!
A strategic dashboard should follow good design practices:
- Brand It: Use your organization or department’s logo and brand colors to personalize the dashboard and create a visual connection for your audience.
- Keep it Clean & Focused: Don’t overload it with too much information. Less is often more!
- Easy on the Eyes: Use whitespace and a logical layout to guide the viewer.
- Relevant Data Only: Focus on the right time periods and key metrics that directly impact strategic goals.
Bringing It All Together: Turn Data into Actionable Insights
Compiling truly informative strategic dashboards can take some time and effort to get right. You need to identify the right metrics, design the dashboards effectively, and ensure the data is accurate and up-to-date. However, by leveraging the wealth of organizational data already within StrategyBlocks, you can create these dashboards as valuable assets that can be viewed at any time – whether in a quick team huddle, a formal meeting, or a crucial boardroom presentation. These dashboards provide a real-time view of your strategic status, saving you valuable time, ensuring accuracy, and empowering faster, more informed decisions. Our powerful and customizable dashboards are one of StrategyBlocks’ key differentiators, and we genuinely enjoy helping our customers build them. If you’d like assistance in creating strategic dashboards that unlock the full potential of your data, we’d be happy to help!


Great read! This guide really captures the essence of what makes strategic dashboards effective—focusing on the right metrics, not just more metrics. I liked how it emphasized alignment with organizational goals and the importance of real-time data for informed decision-making.