Personal Charts
Where to find
The Personal Charts page is found under Dashboard -> Charts on the Left-Hand Menu. It displays a series of user specific charts relating to the performance of their blocks, metrics and risks.

Select User
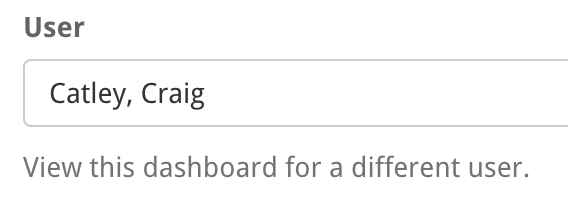
The Personal Charts page displays charts which are specific to the blocks, risks and metrics associated with a specific user. The drop down at the top of the page lets you choose which user.

Blocks Chart
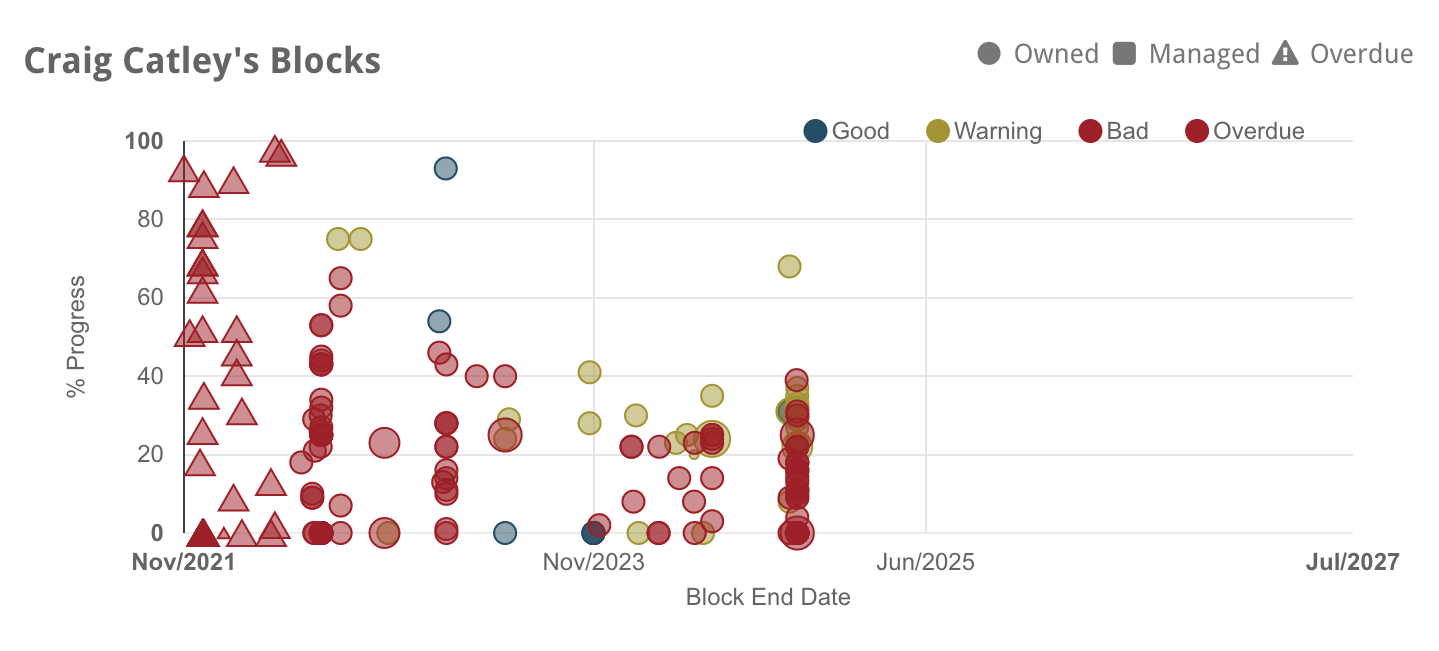
The Blocks Chart shows the progress status of the selected user’s blocks and their expected end date. The different colors are based on the progress of a block vs it’s expected progress.

Blocks Table
This section shows the health ![]() , progress vs expect progress over time, the current progress within the bounds of bad (dark grey), behind target (light grey) and on target (clear).
, progress vs expect progress over time, the current progress within the bounds of bad (dark grey), behind target (light grey) and on target (clear).

User Metrics Table
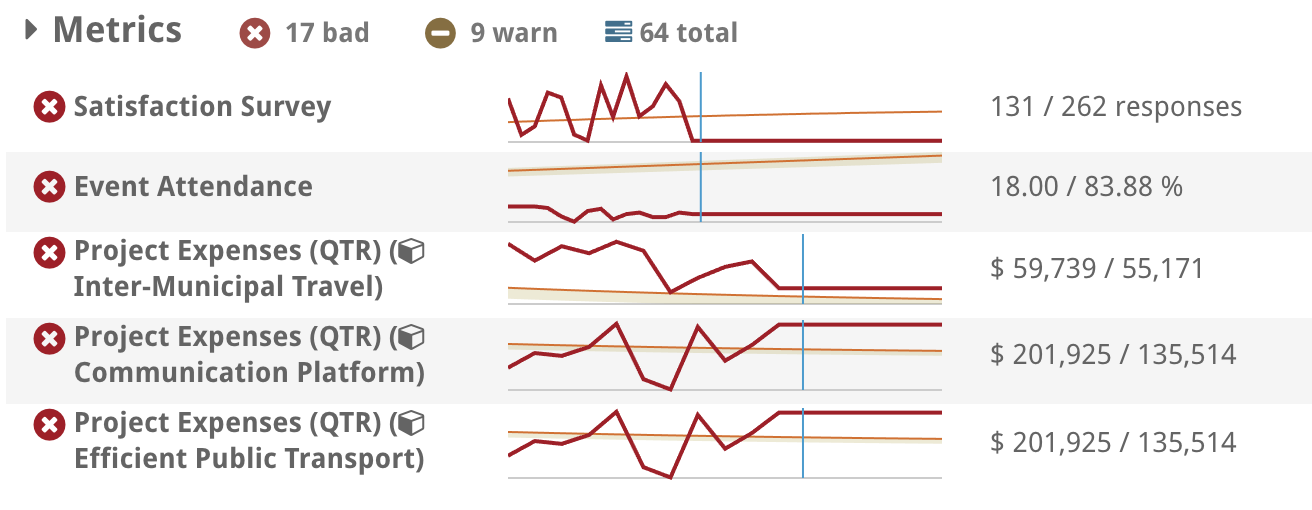
The user metrics table covers each of the metrics associated with the selected user. It shows a graph of metric actuals vs targets, and also of total metric completion against its target.

User Risks Table
The user ricks table covers the risks associated with the selected user. It shows their title, status, and next actions required (if any).


