Metrics Table
About
The metrics table is where data is entered and viewed, tracking the real data behind your company. For example, this is where you can enter your actual financial performance, as compared to projected, and then analyse the information graphically or textually.
Where to find
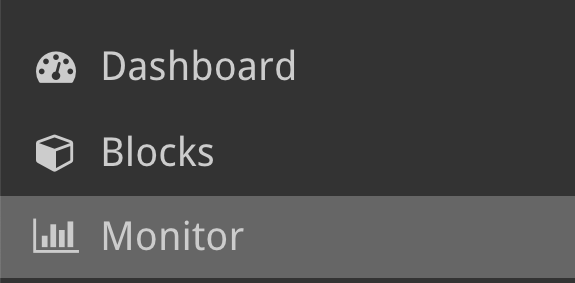
The Metrics Table displays all the metrics you’ve created. It is found through the Monitor tab on the Left-Hand Menu.

Create a new metric
Click on the “New” button in the top right to create a new metric. There are three types of Metric:
- Normal – where you manually enter targets and actuals.
- Calculated– use a series of fixed numbers and other metrics to create a new metric.
- Cascading– similar to calculated, but pre-set.
Note: metrics can be entered for blocks on any level, not just the leaves, but only cascading metrics reflect the data for that block.


![]()
Select a Metric
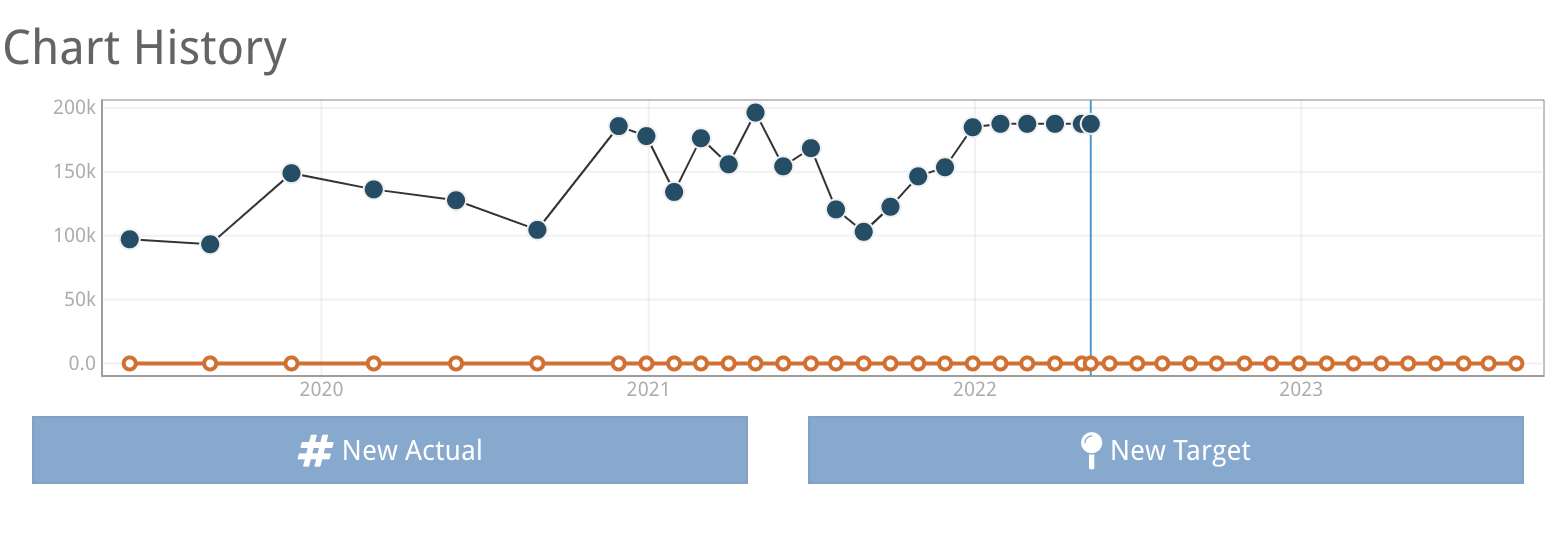
Double clicking on any metric in the table will open its’ overview page and update the side menu with metric options. On the overview page you can add targets or actuals which are then reflected in the metric graphs.
If the actuals buttons are greyed out, this means you do not have access, and cannot update this metric.

Top Bar Options
The Rows drop down lets you select how many rows are shown on the table per page. Pages can be navigated between using the buttons on the bottom right of the table.
The Columns button takes you to a new page which allows you to fully customise which columns appear in the risk table.
The CSV button allows you to download the risk table to computer as a CSV file which you can then enter into excel, google sheets or your spreadsheet application of choice.


